> ## Documentation Index
> Fetch the complete documentation index at: https://docs.codenullapp.com/llms.txt
> Use this file to discover all available pages before exploring further.

# Dashboards

> list of the charts available to use:&#x20;

## Type of charts

list of the charts available to use:&#x20;

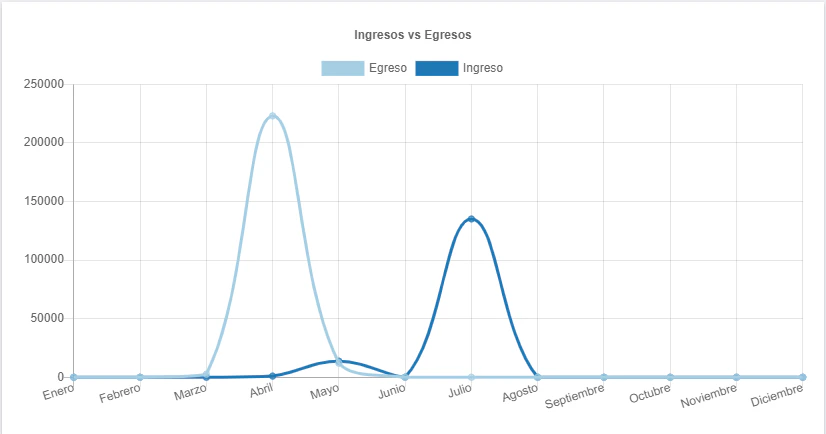
* Line
* Bar
* Radar
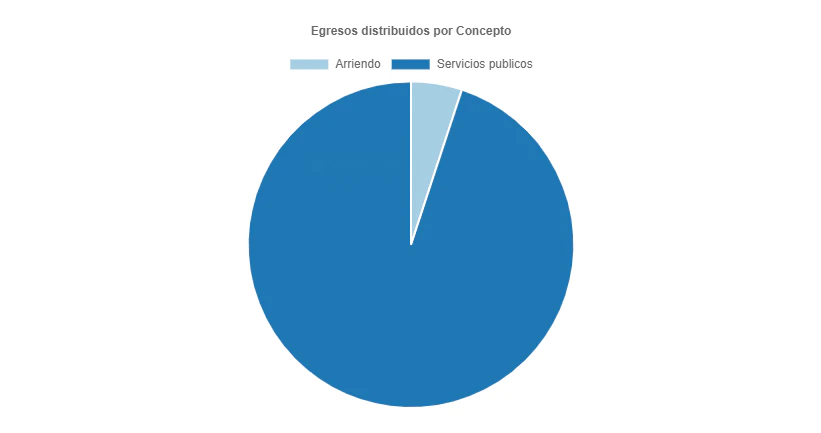
* Doughnut
* Pie
* PolarArea
* Bubble
* Scatter
* Area

some example how looks\ <br />
<img src="https://mintcdn.com/codenull/9RtgKoAtzvpYtN-c/images/-MgFN-xeGcuqZp-xgBCX.png?fit=max&auto=format&n=9RtgKoAtzvpYtN-c&q=85&s=7d56dffffd3e372f71cb1c3e90605ffa" alt="" width="821" height="433" data-path="images/-MgFN-xeGcuqZp-xgBCX.png" />

<img src="https://mintcdn.com/codenull/9RtgKoAtzvpYtN-c/images/-MgFMvfjBf0MDowMNlfU.png?fit=max&auto=format&n=9RtgKoAtzvpYtN-c&q=85&s=c6d1da2e93d89315a973f5ae69188152" alt="" width="826" height="434" data-path="images/-MgFMvfjBf0MDowMNlfU.png" />

Next, you will see how to configure the data source and dashboard properties

<Card title="Broken mention" href="broken://pages/-MgFNPWxW3KEWZVl4uIV" />

<Card title="Transform properties" href="/configurations/components/dashboards/transform-properties" />