- Enabling debug mode (Only for web applications)
- Server Logs (Web and Mobile)
- Custom Logs (Web and Mobile)
Debug Mode
This option allows you to debug your application using the Browser console tool. To enable this go to the Settings panel and enable on Debug Mode checkbox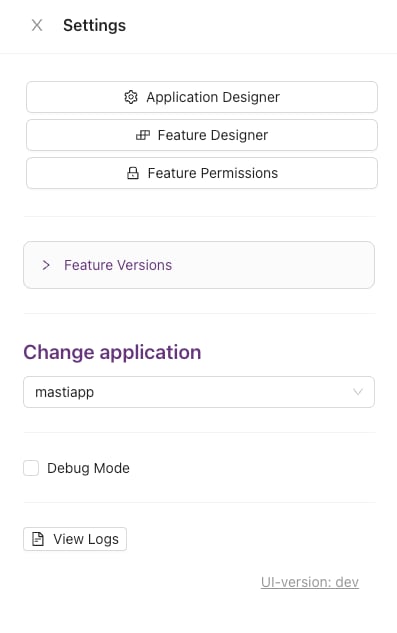
Server Logs
To enable this please contact us to enable this option. After this option is properly enabled you can go to the Settings panel and click on “View Logs”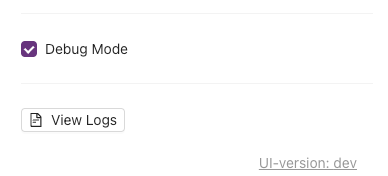
Custom Logs
This option is useful when you need to debug remotely (for instance from the server or a mobile client)
How to send custom logs
When you are writing your hooks or client rules you can use thesendLog function
Hooks
Client Rules (Mobile and Web)
Graphql Logs
To see this option you need to go to the Settings panel and click on “View Logs” button- Query or mutation executed
- Variables sent
- Respond data