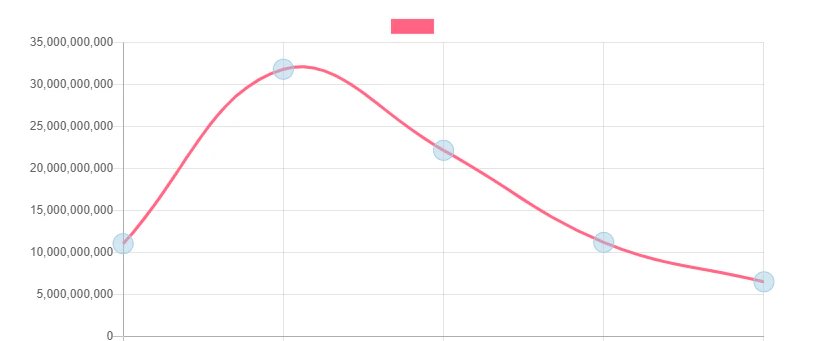
Use formats to modify how the values that are shown in the chart.
Use formats to modify how the values that are shown in the chart. Now the formats can be applied to the Axis Y and the tooltip in the dashboard Item.
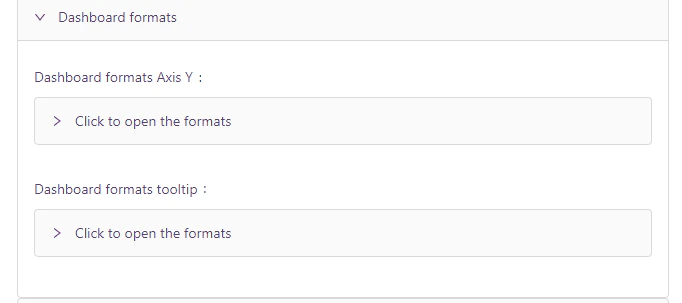
In the Generator of the dashboardItem you will find a new section “Dashboard formats”Dashboard formats Axis Y: Will apply formats to the left values of the chart ‘Axis Y’Dashboard formats tooltip: Will apply formats to the tooltip of the bar, line, etc.